|
커뮤니티
|
DSP/SPEECH
|
|
|
제목:
python코드 - wave 로드,저장,play, 스펙트럼, griffinlim 신호 재생 |
|
|
|
4027 김윤중  |
|
|
|
|
- dynamic play / audio stream play
- import numpy as np
import sounddevice as sd
# synthesize a pure tone at 440 Hz:
sr = 22050 # sample rate
T = 2.0 # duration in seconds
t = np.linspace(0, T, int(T*sr), endpoint=False) # time variable
x = 0.5*np.sin(2*np.pi*440*t)
sd.play(x,sr)#play audio data holded in nparray x with sampling rate sr
sd.wait() #wait until playaback is finished
- 오디오 load/write/STFT/ISTFT/griffinlim
- import librosa
import librosa.display
#load audio signal from 30 sec to 35 sec from 'example_audio.wav'
y, sr = librosa.load('example_audio.wav', offset=30, duration=5)
# Get the magnitude spectrogram
S = np.abs(librosa.stft(y))
# Invert using Griffin-Lim
y_inv = librosa.griffinlim(S)
# Invert without estimating phase
y_istft = librosa.istft(S)
librosa.output.write_wav('origin.wav',y,sr)
librosa.output.write_wav('reconstructed_griffinlim.wav',y_inv,sr)
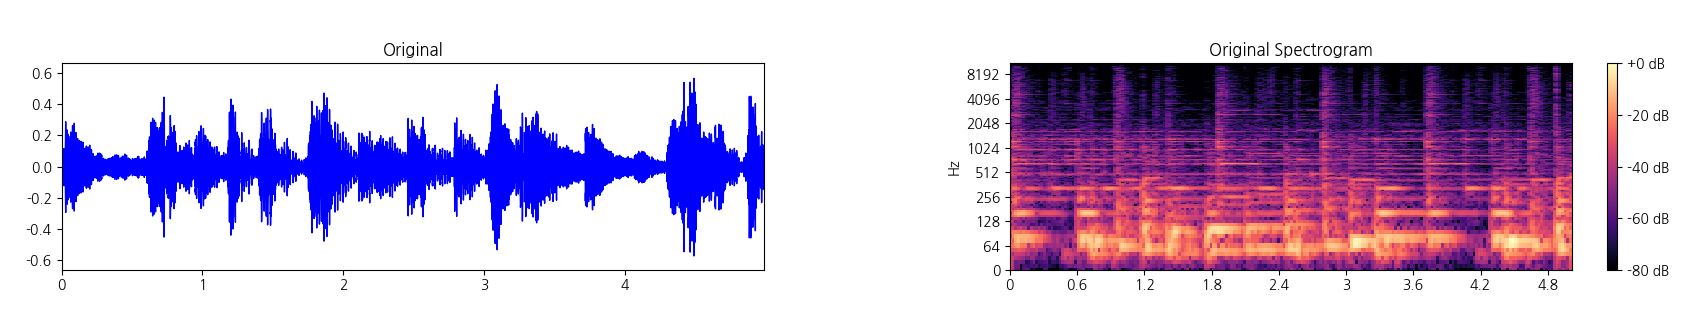
- plot wave form and spectrum
- import librosa
import librosa.display
- #plot wave form
plt.subplot(121)
y, sr = librosa.load('example_audio.wav', offset=30, duration=5)
librosa.display.waveplot(y, sr=sr, color='b')
- #linear spectrogram
plt.subplot(122)
S = librosa.stft(y) #create linear spectrum incomplex number
Sdb = librosa.amplitude_to_db(abs(S),ref=np.max) #convert abs value to deci bell
librosa.display.specshow(Sdb,sr=sr,x_axis='time',y_axis='log') #plot linear spectrum on log scale
plt.colorbar(format='%+2.0f dB')
plt.show()
 -
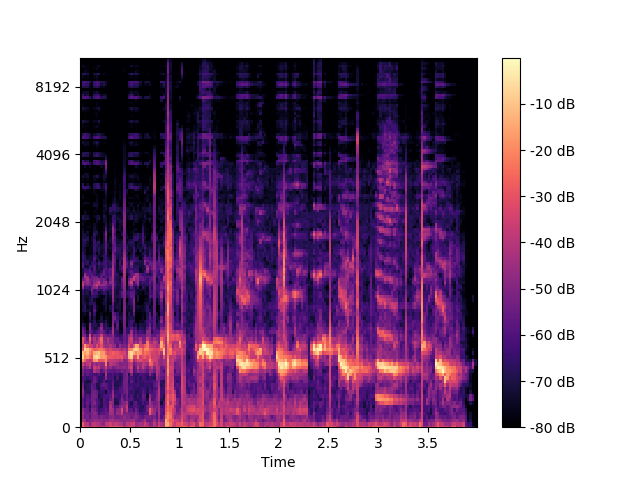
- melspectrogram
-
filename = 'audio/Haunting_song_of_humpback_whales-youtube-W5Trznre92c.wav'
y, sr = librosa.load(filename) #y(946688,) sr=22050
#Compute a mel-scaled spectrogram
S_mel=librosa.feature.melspectrogram(y=y, sr=sr,n_fft=2048, hop_length=sr//4, n_mels=128)
#s:(n_mels,y.size//hop_length)=(128,1850)
#convert magnitude in decibel
S_mel_dB = librosa.power_to_db(S_mel, ref=np.max) #(128,1850)
#plot S_mel_dB(mel_spectrogram in debel) on mel frequency scale
librosa.display.specshow(S_mel_dB, x_axis='time', y_axis='mel', sr=sr, fmax=sr //2)
plt.colorbar(format='%+2.0f dB')
plt.show()
-
음성파일 wav_fn의 신호를 초당 100개의 mel_spectrogram vector 로 변환
# (100n,8) /n sec wav
#입력 : sample 길이 48000(16000x3초) sound signal
#출력 : feature timestep=300, dimension:80
# fft: win_lwngth=n_fft=2048(0.128초)
y, sr = librosa.load(wav_fn,sr=16000) #48000=16000x3초
C = librosa.feature.melspectrogram(y, sr, None,
n_fft=2048, hop_length=160, power=2.0, n_mels = 80) #(80,48000/160=300+1)
C = librosa.core.amplitude_to_db(C) #(80,301)
C = pre.minmax_scale(C,feature_range=(-1,1), axis=0).T[:-1] #(80,301)=>(300,80)
-
참고
-
S=librosa.feature.melspectrogram(y=y, sr=sr,S=None, n_fft=2048, hop_length=512, n_mels=128,win_length=None, window='hann', center=True, pad_mode='reflect', power=2.0)
#s:(n_mels,y.size//hop_length)=(128,1850)
-
D = np.abs(librosa.stft(y))**2 #(1025,1850) Compute a linear stft and powered
S = librosa.feature.melspectrogram(S=D, sr=sr) #(128,1850) convert mel scale
- spectrum으로부터 신호의 재구성
- S = librosa.stft(y) #create linear spectrum incomplex number from audio signal
y_inv = librosa.griffinlim(np.abs(S)) #reconstruct audio signal from sptectrum
librosa.output.write_wav('origin.wav',y,sr)
librosa.output.write_wav('reconstructed_griffinlim.wav',y_inv,sr)
- waves
- beat notes
- 4 octave - generated sample
|
|
|
|
|
|
|
|
|
|
|
|
|
|
|
|
|
|
|
|
|
|
|